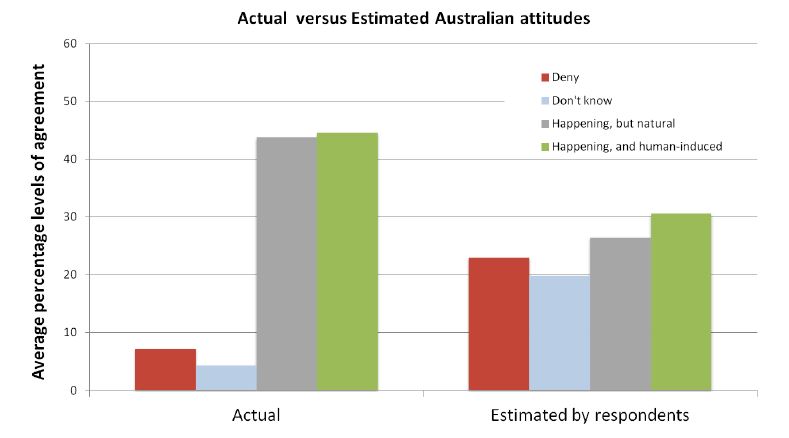
I came across an interest graphic from the CSIRO recently that gave me pause to think. The graphic was in a CSIRO publication “Second Annual Survey of Australian Attitudes to Climate Change” (you can access the PDF here)
The picture showed two graphs side by side. The first graph show a breakdown in the acceptance or belief in climate change of the population in Australia. There were no real surprises there in terms of what I already understood about attitudes to climate change.
However, the second graph caught me by surprise. This graph showed what people “thought” the rest of the population thought about climate change. On average, respondents overestimated the proportion of people denying that climate change was happening, and underestimated the proportion who thought climate change was happening due to either natural or human processes.
This was interesting for two reasons
First, it showed that the level of concern about climate change was much higher than most people think
Second, as a subsequent graph in the report indicates (not shown here), that every group overestimated the percentage of people who denied that climate change was happening.
So maybe we’re convincing ourselves that there is a level of climate denial that is simply not there despite what some sections in the media, politics and lobby groups would have us believe. If that’s the case, then maybe we should be a bit more open about our thoughts and opinions in this matter and start to publicly turn around this perception so that people are more willing to openly express there concerns.
There is some really interesting material in the report so have a look and see what you think. Does this change the way you might approach the topic with other people?


